How monitor postgresql
Key metrics for PostgreSQL monitoring
Monitoring PostgreSQL allows you to track query performance, resource utilization, availability, and more. Let’s look at the important metrics for PostgreSQL that you should monitor.
Query throughput and latency metrics
If your queries are taking longer to execute than they should, it doesn't matter what type of machine or database you use. So always keep track of query latency if it is growing exponentially with the size of your table or database.
Consider the library analogy: each query is a request for information. To understand the pace of this interaction, let's calculate the average latency using the following SQL query:
SELECT query, mean_exec_time
FROM pg_stat_statements
ORDER BY mean_exec_time DESC
LIMIT 5
This query gets the top 5 queries based on average execution time, providing insights into potential bottlenecks. You can also pg_stat_statementsview other metrics from the table based on your requirements, such as the number of invocations or
the minimum and maximum execution times.
Analyzing this data helps identify queries that may be causing performance issues so that targeted optimization efforts can be performed.
Disk Utilization and I/O Operations
PostgreSQL is responsible for managing how data is stored on disk and how it is retrieved when needed. This process is usually invisible to end users, but is critical to database performance.
Disk utilization and I/O operations are key aspects of PostgreSQL performance. Disk utilization refers to the amount of disk space used by the database. I/O operations involve reading or writing to disk storage. Both are important because they can significantly affect the speed and efficiency of your database. High disk utilization or inefficient I/O operations can slow down your database.
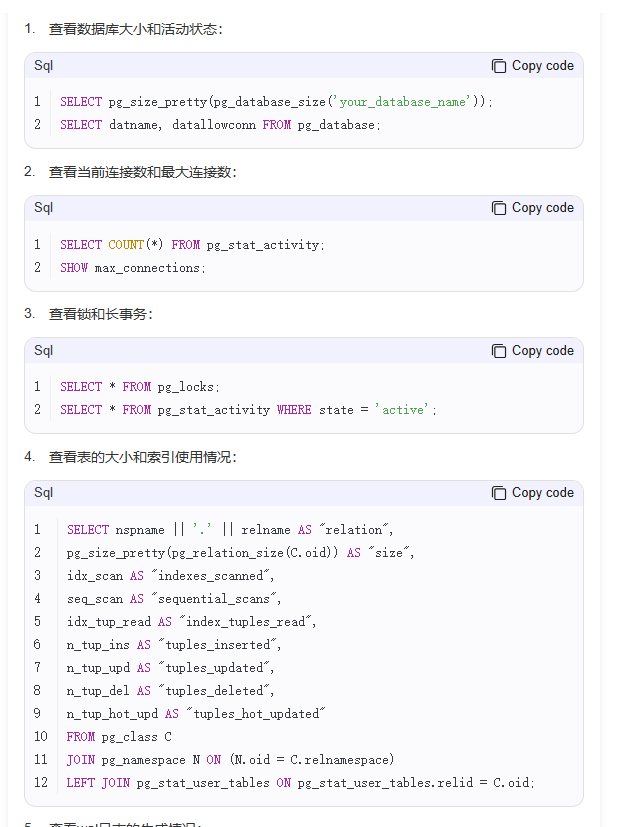
You can use the following query to periodically monitor the amount of disk space used by different objects in your PostgreSQL database:
SELECT object_type, object_name, schema_name, size FROM
(SELECT
    'Table' AS object_type,
    relname AS object_name,
    schemaname AS schema_name,
    pg_total_relation_size(relid) as size_bytes,
    pg_size_pretty(pg_total_relation_size(relid)) AS size
FROM
    pg_catalog.pg_statio_user_tables
UNION
SELECT
    'Index' AS object_type,
    indexrelname AS object_name,
    schemaname AS schema_name,
    pg_total_relation_size(indexrelid) as size_bytes,
    pg_size_pretty(pg_total_relation_size(indexrelid)) AS size
FROM
    pg_catalog.pg_stat_all_indexes
) as data
ORDER BY
    size_bytes DESC
This query uses a function called pg_size_pretty to calculate the size of each table and index in both bytes (size_bytes) and in human-readable format (size).
If you are using PostgreSQL and want to check if there are any extra indexes that might be affecting the performance of your database, you can use a simple query. This will show you a list of all the indexes in your database:
SELECT * FROM pg_catalog.pg_stat_all_indexes
Locks and deadlocks in PostgreSQL
To monitor PostgreSQL locks and deadlocks, you can use built-in as well as third-party tools.
pg_locks: This is a PostgreSQL system view that provides information about all current locks in the database. It displays details such as the type of lock, the process ID (PID) of the process holding the lock, and the specific database resource (such as table, row, etc.) that is being locked.
pg_stat_activity: This view complements by providing additional context for each process, such as the database it is connected to pg_locks. Using the PID by pg_locksconnection pg_stat_activityallows you to see not only the lock, but also which database and query is involved.
The provided SQL query will be joined pg_lockswith pg_stat_activityto show a comprehensive view of current locks:
SELECT
    pg_locks.pid,
    pg_stat_activity.datname,
    pg_locks.mode,
    pg_locks.relation,
    pg_locks.page,
    pg_locks.tuple
FROM
    pg_locks
JOIN
    pg_stat_activity ON pg_locks.pid = pg_stat_activity.pid
From:Is Everything OK


COMMENTS